


Thank you for your message. It has been sent.
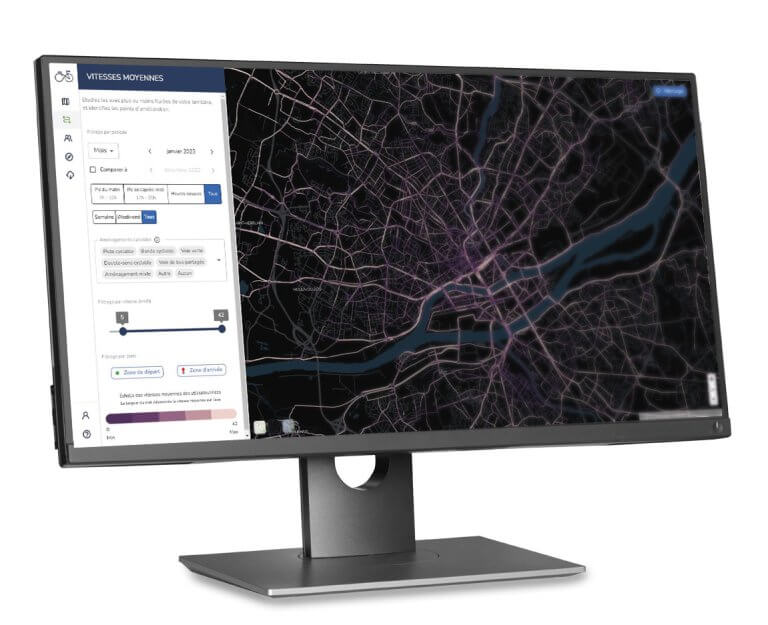
Software & analysis tools
Eco-Visio
Learn More

Software & analysis tools
Data validation & reconstruction
Learn More
Software & analysis tools
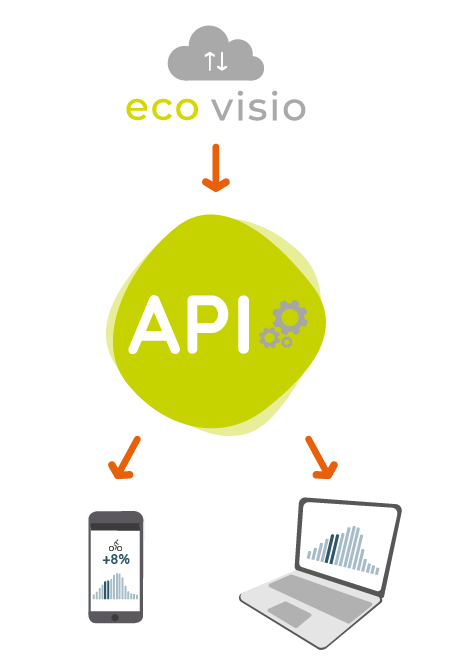
Eco-Visio API
Learn More
Software & analysis tools
Cycling Insights
Learn More
PYRO Evo Range
Nature Post Evo
Learn More

PYRO Evo Range
PYRO-Box Evo
Learn More

PYRO Evo Range
Urban Post Evo
Learn More
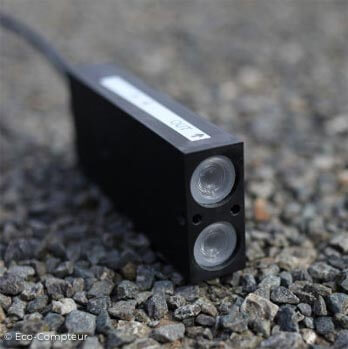
PYRO Range
PYRO Sensor
Learn More
PYRO Range
PYRO-Box
Learn More

PYRO Range
ReCycled Post
Learn More
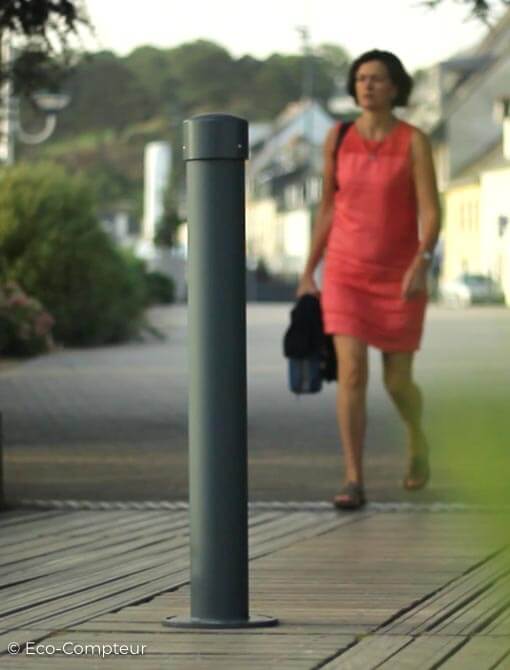
PYRO Range
Urban Post
Learn More

ZELT Range
ZELT Evo
Learn More
ZELT Range
Easy ZELT
Learn More
MULTI Range
Urban MULTI
Learn More
MULTI Range
Mobile MULTI
Learn More
MULTI Range
MULTI Cars / Buses
Learn More
MULTI Range
MULTI Nature
Learn More
Real-time Displays
Eco-DISPLAY Classic+
Learn More
Real-time Displays
Eco-DISPLAY Light Edition
Learn More
Real-time Displays
Eco-DISPLAY Compact
Learn More
2019 Worldwide Cycling Index
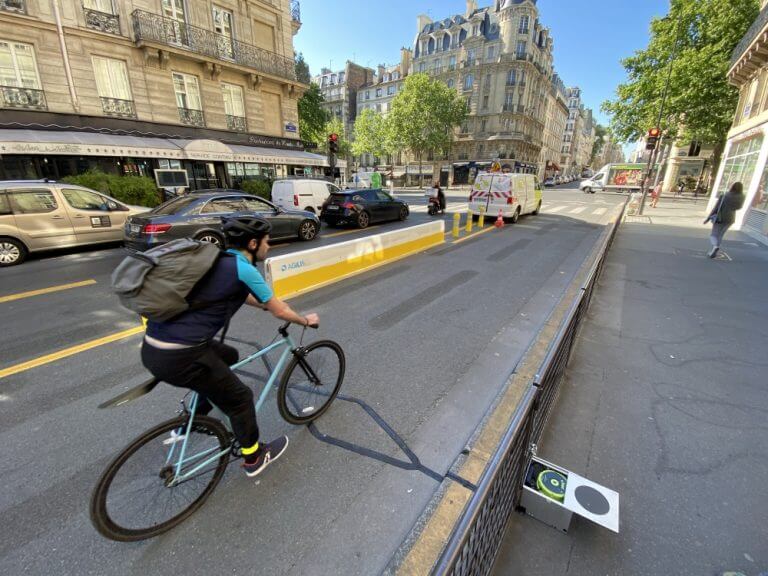
Please find below the 5th Worldwide Cycling Index, a global analysis we are leading since 2014 on all our bicycle counters installed in the world. The highly anticipated Index draws bike count data from over 3,000 automated counters across 39 countries to estimate the overall progression of bicycle traffic volumes by country and city.

Eco-Counter has partnered with NewCities to release the 2019 World Cycling Index. The results of the Index has been announced at the Wellbeing Cities Forum in Montreal – a city Eco-Counter proudly calls home – on June 20.
Eco-Counter’s data is a vital tool for bicycling planners and cities. The data can serve as a reliable and accurate source for informing projects and local infrastructure that contribute to increased bike activity in cities.
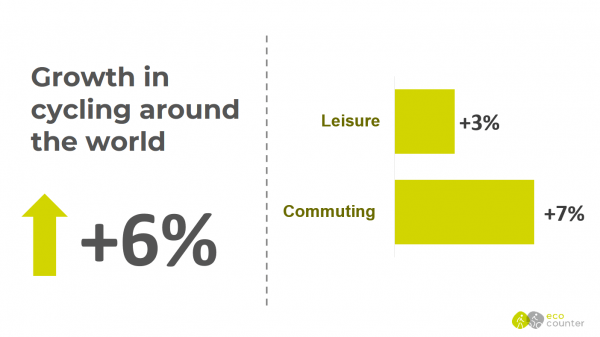
Progression is calculated by comparing total bicycle counts between 2017 and 2018. This analysis is based on data coming from automated bicycle counters with at least 4 months of comparable and validated data.
Source: 2017-2018 progression – 3,266 counting sites in 39 countries / Bicycle for transportation: +7% (1,518 counting sites, 35 countries / Bicycle for leisure: +3% (1,306 counting sites, 25 countries)
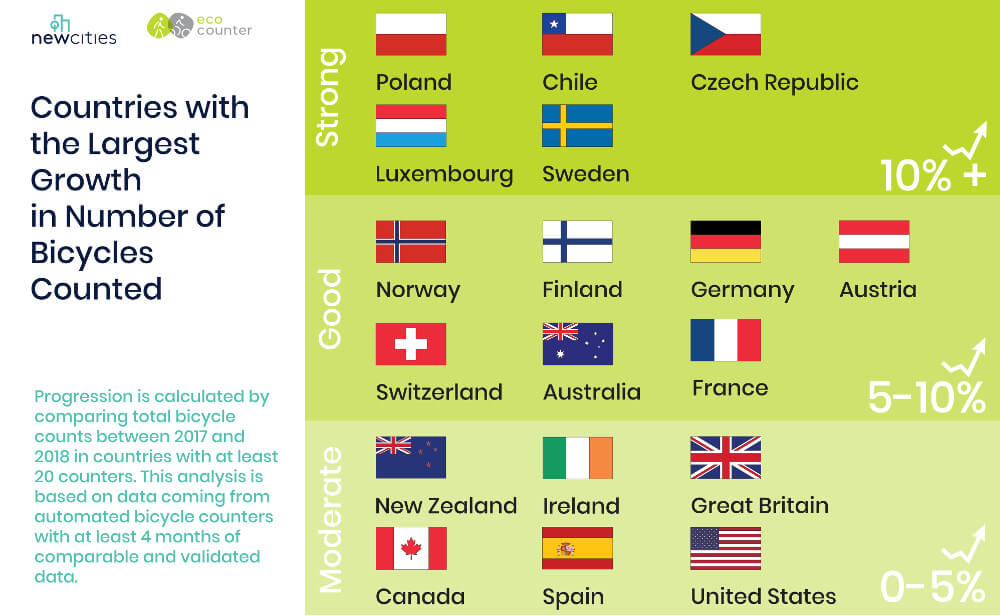
Progression is calculated by comparing total bicycle counts between 2017 and 2018 in countries with at least 20 counters.
This analysis is based on data coming from automated bicycle counters with at least 4 months of comparable and validated data.
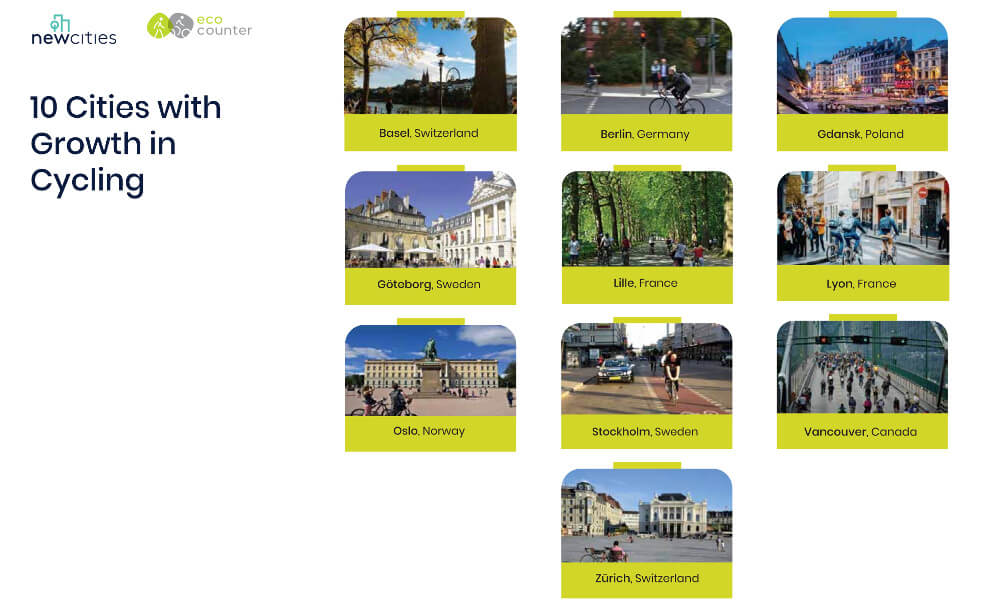
Progression is calculated by comparing total bicycle counts between 2017 and 2018 in cities with at least 15 counters. Number of cities included in the ranking: 57 cities.
This analysis is based on data coming from automated bicycle counters with at least 4 months of comparable and validated data.
|
Total |
Commuting |
Leisure |
|
Tuesday 8th May |
Tuesday 29th May |
Sunday 6th May |
This analysis is based on data coming from automated bicycle counters with a full year of validated data in 2018. Total bicycle counts have been summed-up for each day of the year.
(Source: 1383 counters, 27 countries – including: commuting: 681 counters, leisure: 541 counters)

The most frequented site during the night is located in Stadt Münster with a daily average of 1,087 cyclists counted between 10:00pm an 6:00am in 2018.
This analysis is based on data coming from automated bicycle counters with at least 4 months of validated data in 2018. The daily average number of cyclists between 10:00pm and 6:00am is calculated for each counting site.
(Source: 2018 – 3,266 counting sites)
|
Position |
City |
Country |
% of cycling activity from 10:00pm to 6:am |
|
1 |
Arica |
Chile |
12% |
|
2 |
Hamilton |
Canada |
11% |
|
3 |
New-York |
US |
11% |
This analysis is based on data coming from automated bicycle counters with at least 4 months of validated data in 2018.
The percentage of cycling activity at night is calculated by comparing the average number of cyclists between 10:00pm and 6:00am with the average daily traffic for every city with at least 3 counters.
|
World |
Friday 27th July (97,199) |
Friday 13th July (87,712) |
Friday 15th June (86,110) |
|
US |
Wednesday 4th July (Bank holiday) |
Friday 13th July |
Friday 20th July |
|
Canada |
Friday 1st June |
Saturday 14th July |
Friday 13th July |
|
France |
Thursday 21st June (Fête de la Musique) |
Friday 6th July (Quart de finale France Uruguay) |
Tuesday 10th July (Semi-final France Belgium) |
|
Great Britain |
Saturday 5th May |
Tuesday 3rd July |
Wednesday 11th July (Semi-final England – Croatia) |
|
Ireland |
Tuesday 26th June |
Friday 29th June |
Thursday 28th June |
|
Germany |
Friday 27th July |
Friday 29th June |
Friday 20th April |
|
Sweden |
Friday 1st June |
Friday 27th July |
Friday 3rd August |
|
New-Zealand |
Wednesday 24th January |
Friday 26th October |
Wednesday 12th December |
(source: 1383 counters, 27 countries)
Contact Us!

Search
Do you have a specific need? Use our search engine! 

