


Over 218 million trips logged by 1,490 counters spread across 17 different countries: this is the data which has been qualified and validated for the Eco-Counter Worldwide Cycling Index 2015. The unique scope and range provided by the Eco-Counter cycling database, allows for the accurate measurement of the progression of worldwide bicycle traffic, year-over-year.

Eco-Counter Worldwide Cycling Index: a 3% progression for global bicycle traffic between 2014 and 2015
The Worldwide Cycling Index 2015, unveiled on Feb, 27th at Velo-City Taipei reports a 3% progression of global bicycle traffic between 2014 and 2015. This progression provides further evidence that bicycle usage is currently increasing, whether it is because of cycling friendly policies, new infrastructure or for its efficiency, health benefits or reduced impact on the environment.
And if 3% seems like a small percentage, it still means that Eco-Counter sensors registered over 4.6 million extra bicycle trips in 2015 (compared to 2014). Of course, there is no way to know if all these extra trips would have otherwise been done by car. Yet, when looking at the average distance of a trip generally taken (3km), and the average modal share for car as a means of transportation (roughly 50%), it turns out a +3% rise would still mean a reduction of more than 900 tons of CO2 emissions thanks to this increase.
When looking deeper into the analysis, the countries with the biggest increase are as follow: Spain (+8%), Switzerland & Canada (+6%) and Finland and the US (+4%). Canada and the US are doing very well this year, especially considering that last year’s Cycling Index showed no difference between 2013 and 2014.
![]()
Commuting versus leisure: different patterns to distinguish
Of course, riding a bike can take many forms. It can be done for commuting, as an active and efficient means of transportation, or for leisure and tourism purposes. This means different kind of bicycle uses and different places to ride too. These two very different sub-patterns were analyzed further to better understand the global evolution.
Eco-Counter sensors are installed in urban and natural areas. And thanks to algorithms of pattern analysis crafted by McGill University researchers, the 1,490 counters have been classified in two categories: “commuting” and “leisure”. And it turns out the global 3% rise does not hide a big difference between the two categories, just a slightly quicker pace in one of them. The “commuting” counters registered indeed a +4% progression whereas “leisure” counters registered (only) +2%. This means bicycle usage for commuting purpose is rising slightly quicker than it is for recreational purpose, which is an encouraging figure for everyone involved in making cycling a mode of transportation.
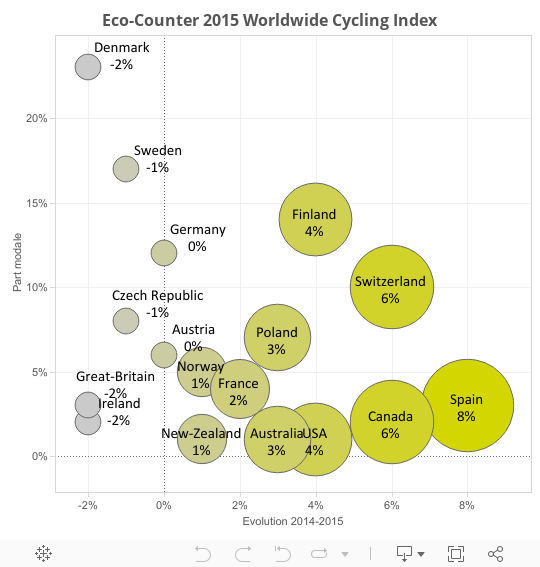
Fig.1 Evolution of bicycle traffic versus bicycle modal share per country (source: « Quality of Travel » – Eurobarometer 2014)
The previous graph is accounting for the current state of bicycle usage (modal share) versus its progression (Worldwide Cycling Index). It displays:
- Countries already using bicycle widely (no surprise here: Denmark, Sweden)
- Countries on the right track to make it happen (Finland, Switzerland, with mid-high modal share, and good progression)
- Countries which still have to do more but currently improving (Spain, Canada, with low modal share, but good progression)
- Countries which are really not there yet (UK, Ireland – low modal share, no progression or –worse- decrease)
Methodology
Global analysis
- Data extracted from “Eco-Visio” global database to analyze bicycle counters only
- Exclusion of counters with less than 4 months of identical data between 2014 and 2015
- Manual check and data validation of the whole database (exclusion of null data, unlikely and/or strong variation)
- Global traffic progression weighted according to country’s population
Per-country analysis
- Countries with less than 10 validated counters were excluded from the analysis


2commentaires
[…] Para obtener más información (en inglés) pincha aquí […]
[…] a French company that develops devices for measuring pedestrian and bike traffic, just released its data from 2015. The results show a 3% increase in biking between 2014 and 2015. Looking at the past two years, […]