


Today, we are starting a new series here on the Eco-Counter blog. Over the next few months, a collection of posts titled ‘How They Use It‘ will shine a light on leading data practitioners and share the innovative and exciting ways they use counters and data. From creative PYRO sensor installations to state-wide counter rental programs, the series aims to highlight the hard work being done by individuals across North America.
In this first post, we look at a fantastic data-fusion statistical analysis presented last month at the 2019 Winter Cycling Congress in Calgary, Alberta.
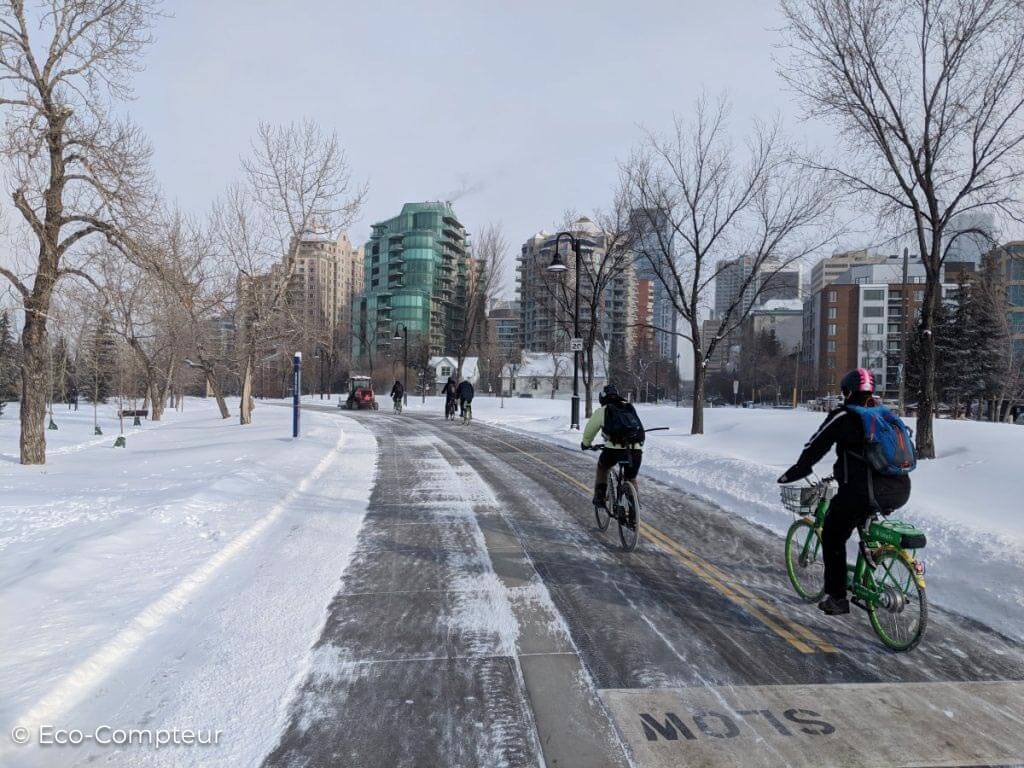
The breakout sessions during the conference showed off Calgary’s extensive, winter-maintained cycling infrastructure
Each February, the world’s leading experts on cold-weather cycling convene for the annual Winter Cycling Congress. Eco-Counter has proudly been a sponsor, exhibitor and presenter at the Congress for many years and, this year, the two-day event was held in Calgary, a City we have worked with for many years. With a fantastic network of maintained, 4-season cycling infrastructure and an average temperatures of -20’C (-4’F) throughout the conference, it was immediately clear why Calgary was hosting.
What can the data tell us?
On the first day, during the breakout session What can the data tell us?, we sat in on a presentation by Kevin Stefan titled Wondering What’s Winter Weather: A data-driven approach. Kevin is a transportation engineer with more than 20 years of experience, including more than 10 years at his current workplace, HBA Specto Inc. His expertise is focused primarily on travel demand model development work, including data preparation, estimation, calibration and validation, including programming in Python.
Kevin’s presentation offered a data-driven approach to understanding how weather impacts cycling in Calgary – a city known for it’s extreme seasonal and wildly fluctuating temperatures. In short, his analysis overlay 4 years of Environment Canada weather data over bike count data that is publicly available through the City of Calgary’s Eco-Counter Public Web Page. Kevin drew on a GitHub script to pull count data from two arterial bike counters in Calgary: the Peace Bridge (average bikes counted per day weekday vs. weekend: 1000, 410) and the 5th Street Cycle Track (average bikes counted per day weekday vs. weekend: 749, 306).
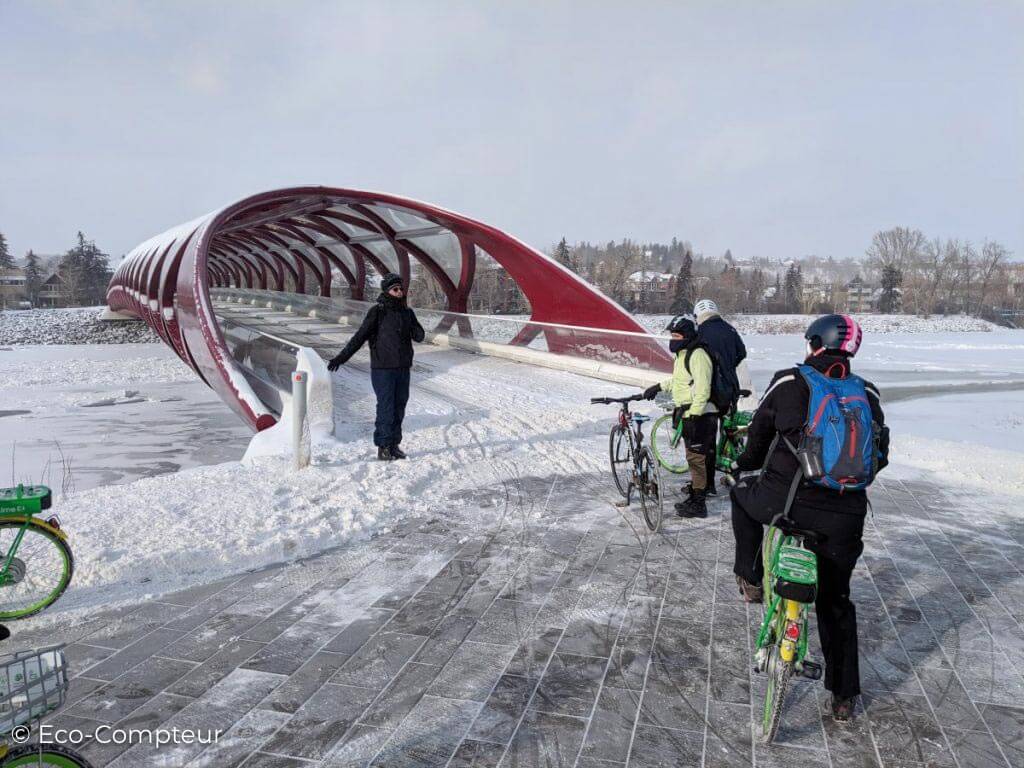
Calgary’s icon Peace Bridge is a crucial link to and from the City for pedestrians and cyclists. A MULTI counter, shown above, tracks daily, weekly and seasonal use trends.
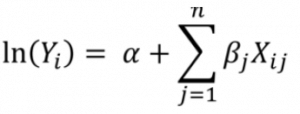
A log-linear regression model was then created to estimate the number of bikes counted each day (dependent variable, Y) based on what the weather was like (independent variables).
The City of Calgary collects bike count data in 15-minute intervals, allowing Kevin to break down cyclists into four distinct groups, shown below.

Weather vs. bikes counted
The impact of weather – including temperature, rain, snowfall, snow on ground, wind, and daylight hours – was then estimated on the number of bikes counted in each group. The results, much like Kevin’s methodology and presentation, are fantastic.
Rain for example, impacts different categories of cyclists differently, with evening and weekend cyclists most negatively impacted.

Snow, conversely, has a similar effect on all groups.

With regards to temperature, weekend cyclists are most sensitive, and peak cyclists are least sensitive. This suggests that for those who depend on cycling as a form of commuting for transportation, temperature is a minimal deterrent (above -15’C (5’F)).

Finally, other conclusions Kevin draws are:
- Wind does not significantly impact the number of bikes counted
- Lack of daylight only affects evening cyclists
- Overall, bikes get put away in December, and are pulled out early summer. Peak cyclists, however, keep theirs out longer in the fall.
Data layering to inform planning
Kevin’s work is a fantastic example of the power of storytelling through data. By combining automated count data with another dataset (in this case, public weather data), Kevin was able to dissect behavioral patterns of cyclists in Calgary. The conclusions from his study area clear, concisely presented and can be used to inform future planning decisions by the City of Calgary.
This blog post does not do justice to the complexity of Kevin’s model nor the hard work put in, so head over to his blog
– MeanMedianModeChoice.com (methodology or results) – to learn more his work.
Thank you Kevin, we love this.
Curious to learn more? Further reading:


There is no comments