


As you may remember from a blog post way-back in February, we are a proud sponsor of the League of American Bicyclists’ Bike Friendly Community (BFC) program.
A few months ago, in collaboration with the BFC, we conducted a survey to examine the current state of bicycle counting. The survey provided a timely and much needed understanding of the way communities across the country approach bike counting, including the challenges and opportunities they face.

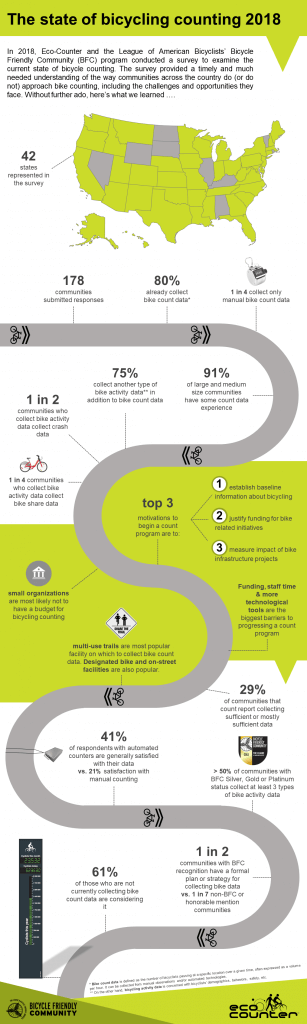
Survey responses were received from 178 communities across 42 states. From all of us here at Eco-Counter and the League of American Bicyclists, thank you to everyone who took the time out of their busy day to respond.
Today, we are pleased to share an infographic (see below) that provides an overview of just what the survey told us. 
Before digging into the full infographic, here are a few (among many) highlights:

The top 3 motivations to begin a count program among communities that have not yet collected bike count data are to:
1) establish baseline information about bicycling,
2) justify funding for bike related initiatives
3) measure impact of bike infrastructure projects

Without further ado, the full infographic!
Throughout 2019, we will continue to comb the data and share further insights in the form of blog posts, newsletters, webinars, and conference presentations. Watch this space!
![]()


There is no comments